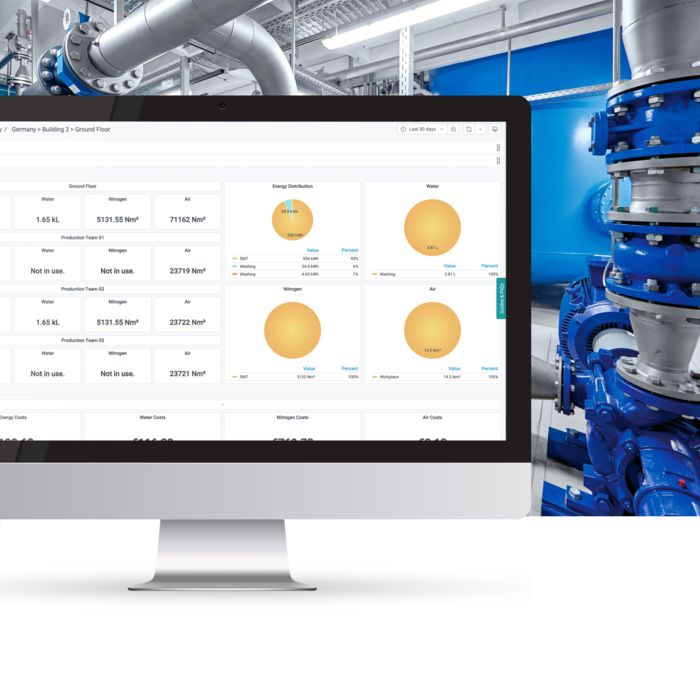
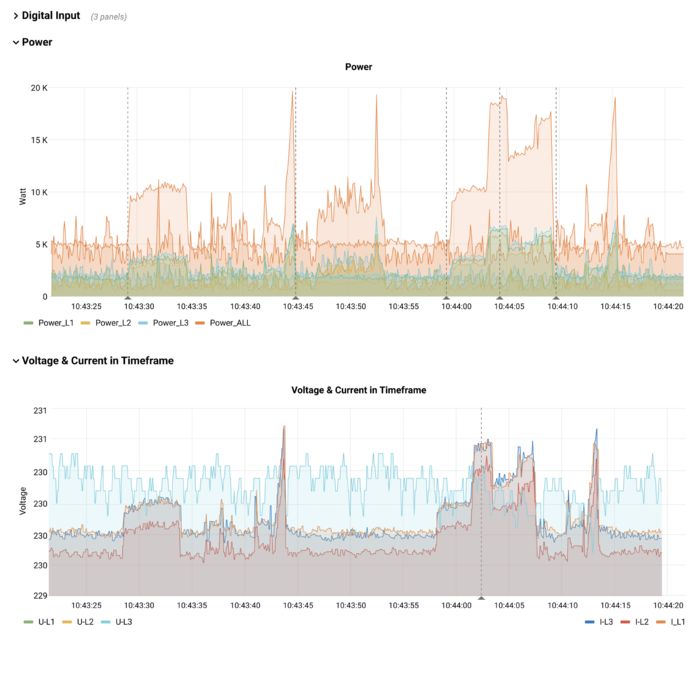
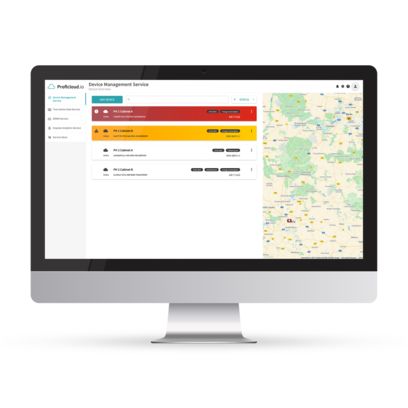
A look at the Time Series Data Service dashboard

Simple and clear visualization of time series data with the Time Series Data Service

Before it can be interpreted, data needs to be visualized. The Time Series Data Service in Proficloud.io, Phoenix Contact’s IoT platform, is the ideal choice for this. In just a few steps, even companies that do not have their own specialist IT personnel can visualize and share data according to their specific needs, and draw conclusions for forecasting, maintenance outlay, and quality assurance purposes.

More information
Employee looks at current data on his hardware in Proficloud.io

All process data available centrally At any time, from anywhere

The Time Series Data Service enables users to retrieve, monitor, and track process data at any time, from anywhere.

Easily configurable, web-based dashboards quickly and accurately visualize all relevant and user-requested parameters, such as the rotation speeds of a wind turbine, motor temperatures, flow rates, and even scrap rates. They form the basis for data-driven decisions and big data applications.

Proficloud.io allows you to use this Smart Service easily – even if you do not have your own or only limited IT resources.

Your advantages

  • No complex configuration due to Plug and Play
  • All process data centrally available – at any time, at any place
  • Easily configurable dashboards for convenient monitoring of all relevant and desired process parameters

Your advantages in detail

Production processes on screens
Man checking time series data on laptop
Time Series Data Service visualized on laptop
Man examining time series data on a tablet
Production processes on screens

Optimization and increased effectiveness in the value chain are primary goals for companies. The Time Series Data Service enables users to access process data from anywhere in the world.
The data of each connected machine is digitalized and can also be analyzed with the Smart Service. Additionally, users have the ability to monitor the data and set user-defined warnings.

Learn more about the Time Series Data Service at proficloud.io
Man checking time series data on laptop

During downtimes, companies do not produce products or add value to the business. Every manufacturing company has the goal of reducing downtimes or at least making them more plannable. With the Time Series Data Service, you know when to expect outages and when maintenance is needed.

Learn more about the Time Series Data Service at proficloud.io
Time Series Data Service visualized on laptop

The quality of a product can be determined by many factors. A variety of these factors can be visualized and analyzed based on data from the machines in the Time Series Data Service.
Be informed at an early stage if products do not meet the set requirements and ensure that defective goods are separated immediately. Complaints can thus be reduced. In addition, energy peaks can be intercepted via early warnings, for example.

Learn more about the Time Series Data Service at proficloud.io
Man examining time series data on a tablet

Every company has employees who know the production processes and the machines better than most other employees, often due to many years of professional experience. This knowledge can be accessed and shared via the Time Series Data Service. Data is visualized and alarms can be set based on data.

Learn more about the Time Series Data Service at proficloud.io
Proficloud.io: Your ticket to Industrial IoT
Learn more about the Time Series Data Service
The Time Series Data Service enables users to retrieve, monitor, and track process data at any time, from anywhere.
Find out more now and try it for free
Time Series Data Services on a screen

The Smart Service in detail

Time series data
Extract of time series data from a machine
Time Series Data “Alert List” widget
Time series data

The “Graph” widget is one of the simplest ways to display time series data as a graph. The data can be displayed as curves, bars, or points. These can also be customized in terms of color.
Alarm messages can also be set up in this widget.

Learn more about the Time Series Data Service at proficloud.io
Extract of time series data from a machine

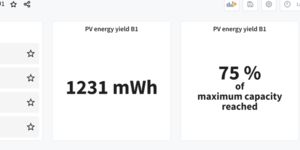
With the “Stat” widget, it is possible to display a specific value (e.g. current, highest, lowest) of an incoming data flow. Values below or above a certain value can be color-coded (e.g. up to 50 = green; above 75 = yellow; above 100 = red).
The user can choose whether to display the background with a curve of the past data or only the current value.

Learn more about the Time Series Data Service at proficloud.io
Time Series Data “Alert List” widget

The “Alert List” widget displays an overview of all alerts issued that warn that a set value has been exceeded or fallen below. The alert list therefore shows past limit violations.
It is also possible to set whether the alerts should be displayed only by one dashboard or by all dashboards created in the account.

Learn more about the Time Series Data Service at proficloud.io
Blade Intelligence dashboards with the Time Series Data Service

Blade Intelligence dashboards with the Time Series Data Service

The Blade Intelligence dashboards in the Time Series Data Service are a comprehensive, cloud-based wind turbine monitoring solution. Using the time series data, you can monitor the condition of your wind turbines online at any time and take the necessary measures to prevent damage. Monitor the ice thickness on rotor blades at low temperatures, for example, and be notified directly with integrated alerting should the ice layer reach a critical level.
Other monitoring functions that are possible with the dashboards on Proficloud.io in the Time Series Data Service include monitoring lightning strikes and the resulting peak load, as well as the bending moments of the individual rotor blades.
In short, the detailed dashboards give you an overview of the condition of the wind turbines.

More information on rotor blade monitoring

The central point for booking Smart Services
Booking Smart Services
The Proficloud.io Service Store model is based on the conventional online store that we all use in our daily lives. Simple to understand and easy to use.
Book now
Smart Services on three screens