Phasor diagram
What you will find in this section:
Phasor diagram
The phasor diagram visualizes the phase angles between the currents and the voltages and thus depicts the asymmetries of the fundamentals.
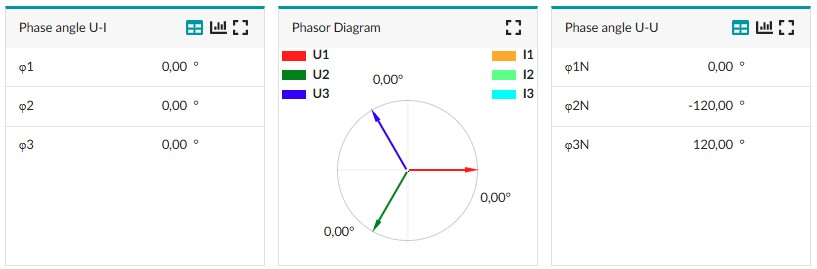
In the middle - new Phasor diagram with Phase angle U-I values (no currents measured)
- The following aspects were taken into account for the visualization:
- The voltage arrow U1 is always at the 3 o'clock position with its zero phase angle φ1N = 0°
- Phase angles U-U: From the 3 o'clock position, positive zero phase angles are rotated counterclockwise and negative zero phase angles clockwise.
- Phase angles U-I: Starting from the respective voltage arrow, positive angles (characterise inductive currents) are rotated clockwise, negative angles (characterise capacitive currents) counterclockwise.
- The radius of the circle corresponds to the average conductor voltage UsysLN
- The length of the individual voltage arrows is proportional to UsysLN according to their values
- The length of the current arrow that represents the highest current value corresponds to 80 % of UsysLN
- The length of the other current arrows is proportional to the longest current arrow according to their values
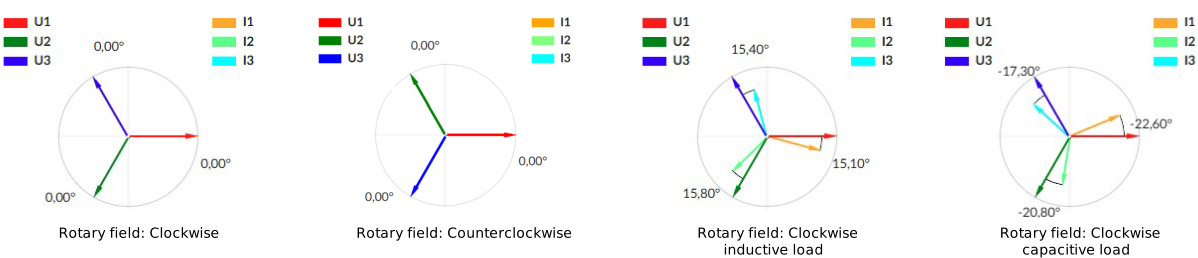
Note: A static reference situation (with U1 = 0 & Time = 0) is always shown in the phasor diagram. The arrows in the phasor diagram would rotate counterclockwise over time, regardless of the direction of the rotary field, if the mapping were dynamic.
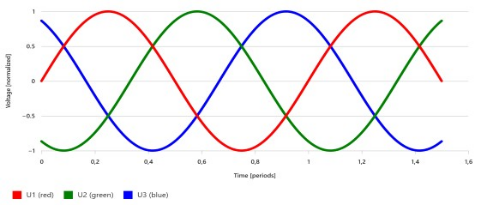
Voltages over time (Rotary field: Clockwise)